Are Web APIs as Available and Performant as You Think?
Originally published at:http://www.apiful.io/intro/2016/06/27/api-quality.html
We frequently preach how web APIs make it easier for applications to interact with external services. When you call them, you expect the server to deliver desired results, and to do so quickly. However, what if an API is unavailable? What if it changes? What if its performance is poor? What if the API is used from around the world, for example by a mobile application? To judge the severity of these questions, David Bermbach from TU Berlin and I recently performed a geo-distributed, long-term study to benchmark web API quality. And we find that web API quality varies significantly...
We wrote a paper about our work and published it at the 16th International Conference on Web Engineering (ICWE2016). The official version of the paper is available at Springer online.
A pre-release version of the paper is available here.
We made our benchmarking tool as well as the collected data available on GitHub.
Quality and how we measured it
There are various measures depicting the quality of a web API, concerning for example performance, security, correctness, or reliability. In our work, we focus on availability and performance from a client's perspective.
We measure availability in terms of pingability (being able to reach the API via ping requests using the ICMP protocol), accessibility (being able to receive any HTTP response for a request), and successability (getting a HTTP response code between 200 and 399). We measure performance in terms of latency, meaning, from a client's perspective, the time between sending a request and finishing receiving a response.
We measured these qualities for 15 hand-selected, public web APIs as listed in table 1. We decided to consider only non-authenticated endpoints of APIs, as to avoid impacts, for example on latency, from authentication mechanisms. We tried to cover diverse APIs in our selection, spanning different provider sizes, countries of origin, or public as well as private organizations.
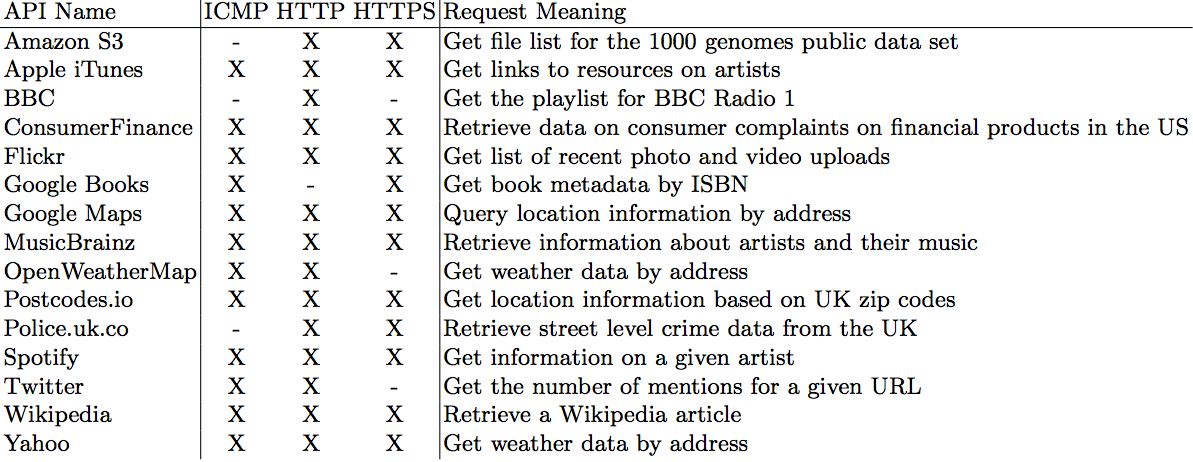 Table 1: Benchmarked API Endpoints and Supported Protocols
In our benchmark, we performed requests to the selected endpoints for all protocols every 5 minutes. We did so from 7 geographic regions across the globe by deploying our benchmarking tool in Amazon AWS' data centers in Ireland, Oregon, Sao Paulo, Singapore, Sydney, Tokyo, and Virginia. Our benchmark ran for 3 month, from August 20th, 2015 (16:00h CEST) to November 20th, 2015 (16:00h CEST).
In the results presented in the following, we anonymized the APIs / endpoints. The reason is that we cannot with certainty attribute errors to providers and don't want to accuse them for API behavior outside of their control. For example, errors may result from failed DNS lookups or network partitionings, which are outside a provider's control.
Availability findings
Figure 1 presents the aggregated results (across all regions, for the whole duration of the benchmark) of our analysis regarding pingability and successability of the API endpoints. "No data available" means that the endpoint does not support the respective protocol. Overall, ping requests succeed in over 99% of cases. The successability of HTTP requests, however, looks worse: of the 14 endpoints supporting HTTP, 8 have an overall successability of over 90% and 4 endpoints have a successability of below 65%. For HTTPS requests, results look slightly better: of the 12 endpoints supporting the protocol, again 8 have an overall successability of over 90% and only one has an availability below 65%.
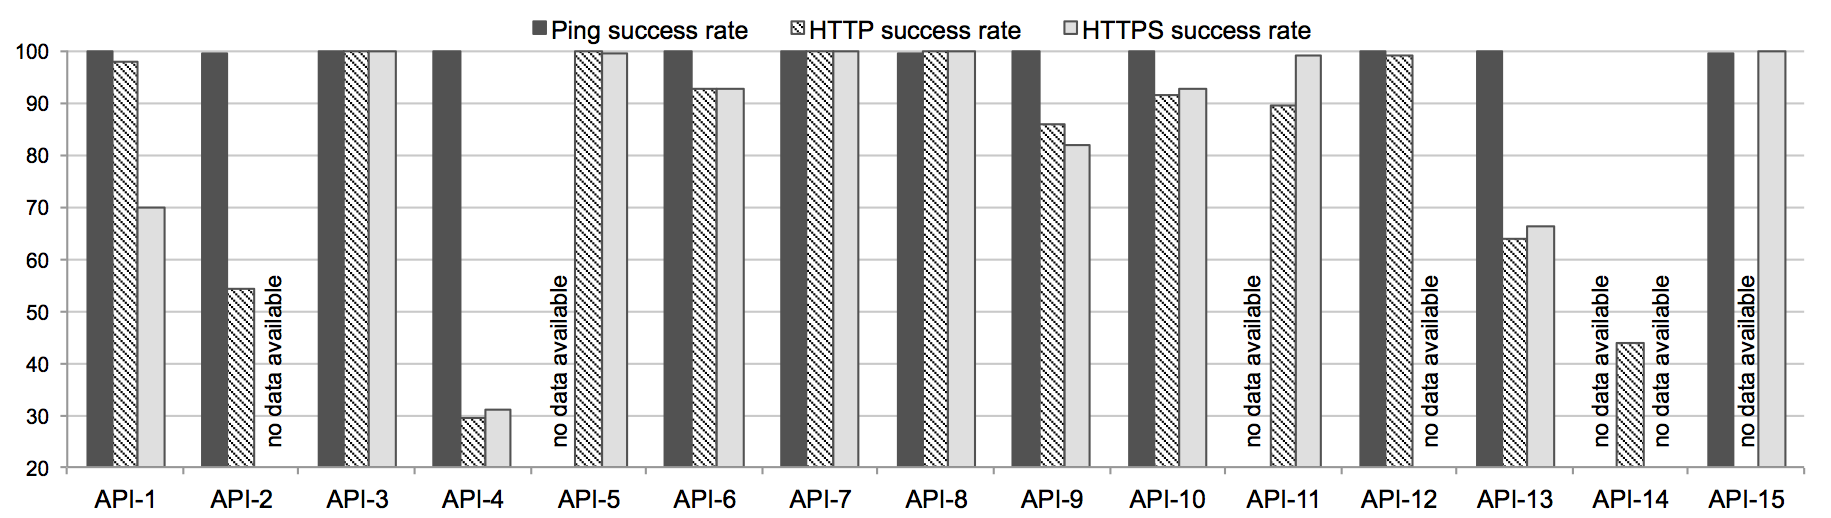 Figure 1: Aggregated Pingability and Successability
Table 2 provides an additional perspective: it depicts - separated by region - the number of days (out of 92) in which requesting an API is basically a coin toss, both for HTTP and HTTPS. That is, performing requests succeeds in only 50% of cases (or less). For example, the entry "78/64" for API-4 in region Sao Paulo shows that we observed 78 (HTTP) and 64 (HTTPS) days at which successability is below 50%. As we can see, even in cases where the overall successibility (across all regions) is above 90% (e.g., API-10), there may be considerable amounts of days during which availability is low in selected regions (e.g., calls to API-10 from Ireland are at best coin tosses in 49 days).
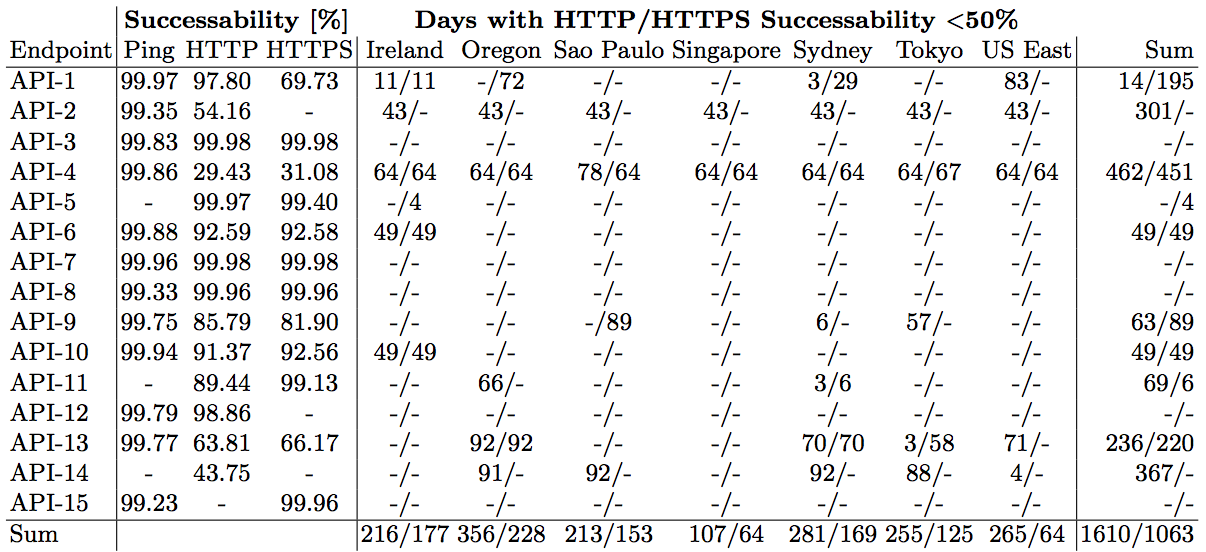 Table 2: Availability of Benchmarked API Endpoints
Figure 2 illustrates a selected example for how availability behaves over the whole experiment for API-4. The Y-axis depicts the HTTP status code received. We assign a made-up status code of 600 for requests that actually did not return any status code (e.g., because the HTTP server went down). We use lines between measured data points to indicate the change of the status code. As figure 2 shows, requests initially mostly succeed (status code 200), with singular exceptions where a server error is reported using status code 500. At some point, however, requests from Sao Paulo start to fail continuously, indicated by status code 600. Requests from all other regions succeed for a while, before they all start returning 401, indicating authentication failures. It seems that the API provider activated authentication for the endpoint. A little later, all requests to the endpoint fail, from all regions. An endpoint stopping to work in such a way can be disastrous for clients relying on it.
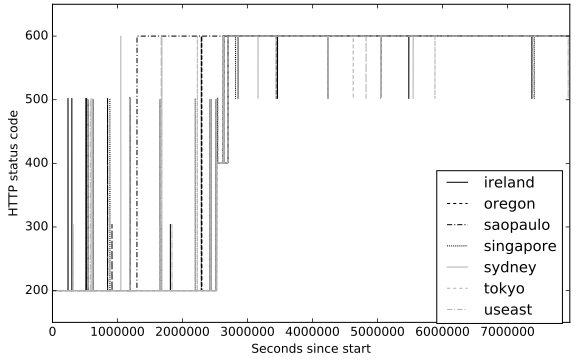 Figure 2: Availability of API 4 Over Time
Latency findings
Next, let's look at findings regarding latency. Figure 3 depicts box plots of the measured latencies for the considered endpoints across regions. First, we notice that, on average, latencies of every API vary significantly across regions. In fact, we find on average that the difference between the mean latency in the best-performing region is 9 times better than the mean latency in the worst performing region, per API. Even for the API with the most homogeneous latency across regions, API-7, there is still a factor of 1.64 separating the best from the worst region. Or, on the other hand, for API-5 the difference is a factor of 27!
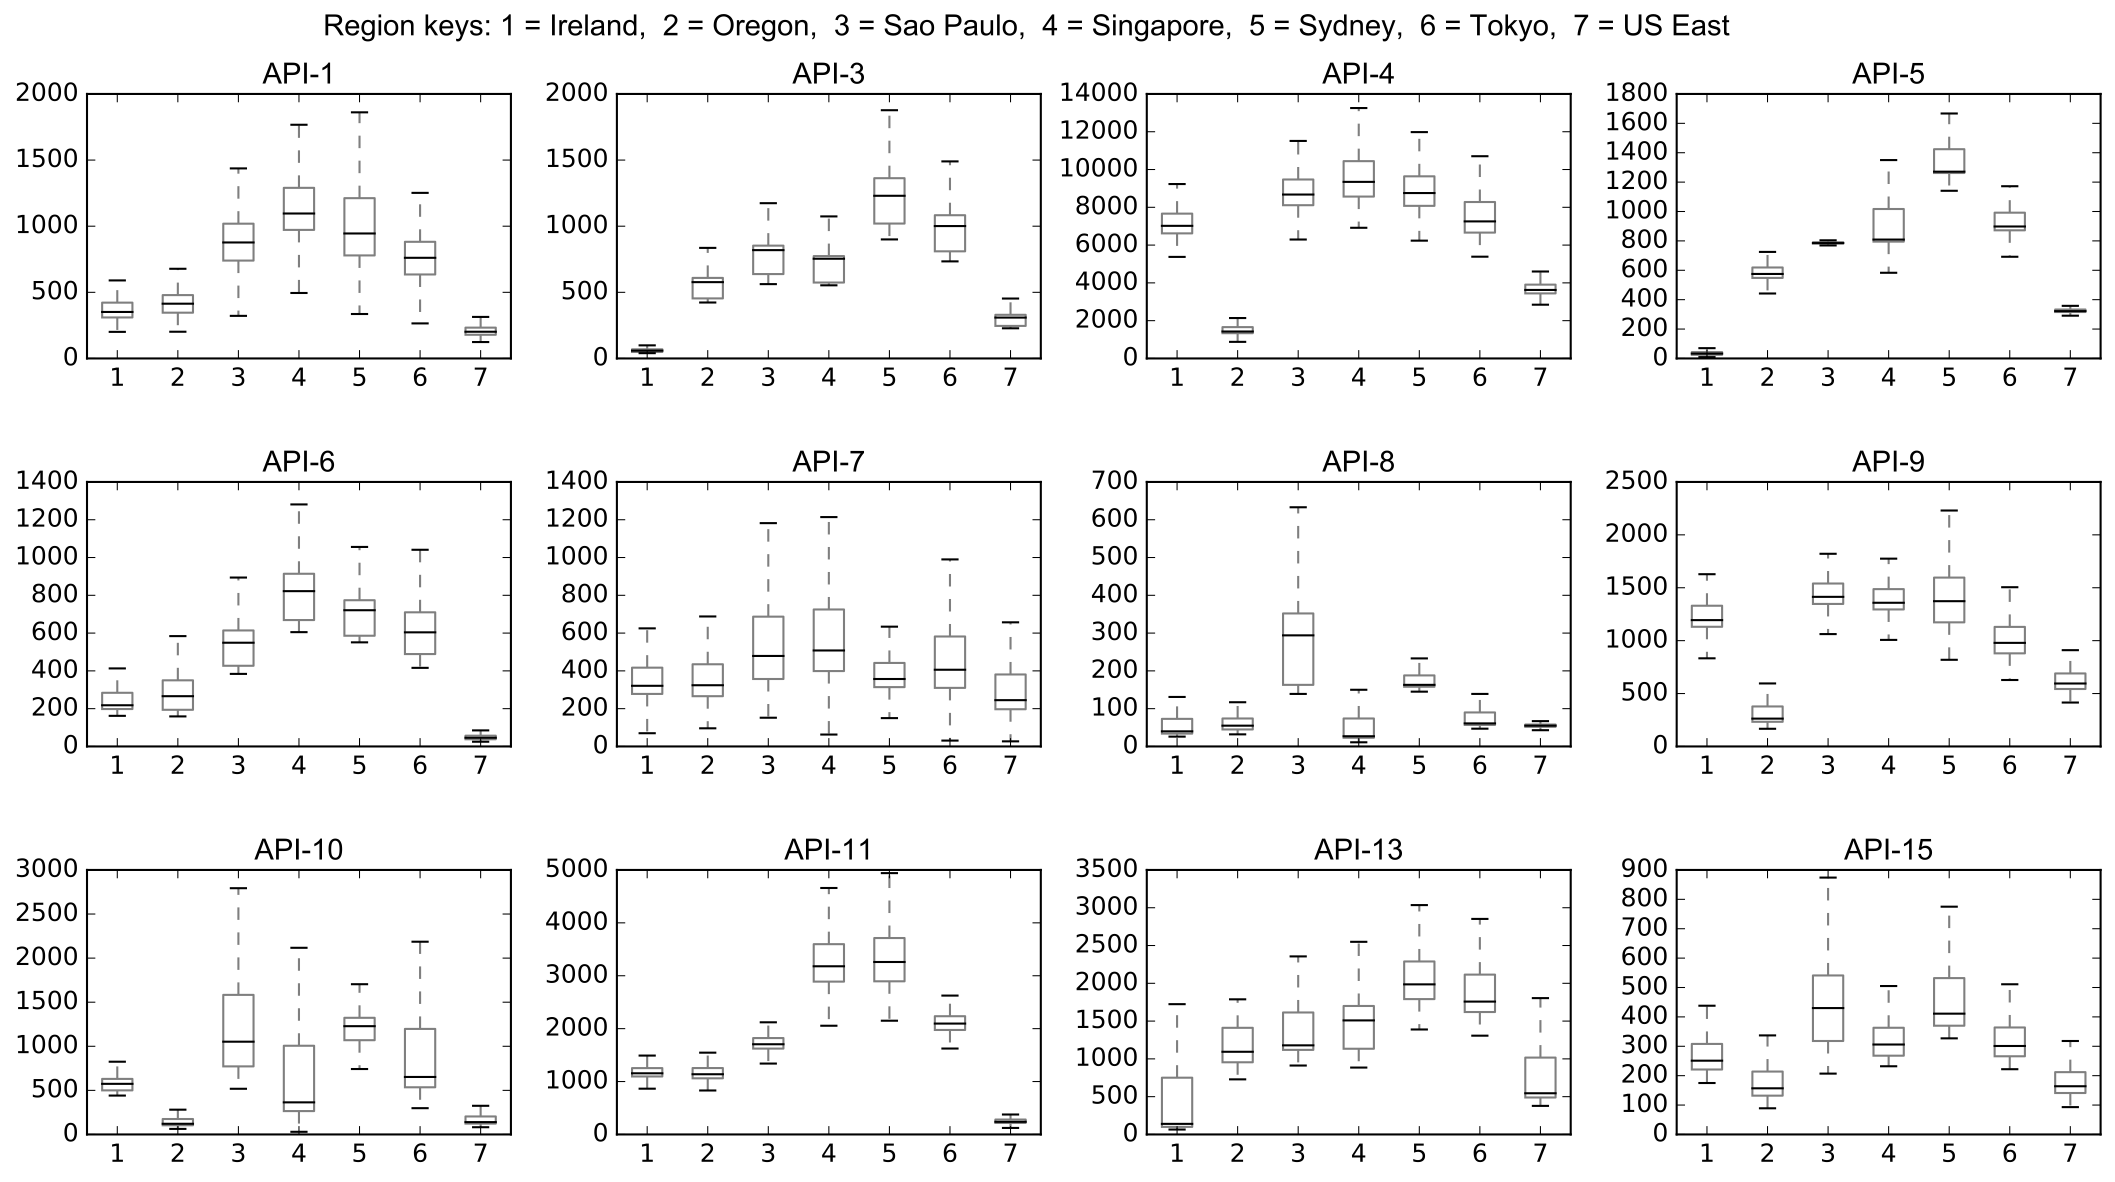 Figure 3: Summary of HTTPS Request Latencies Across Regions in Milliseconds
In addition, even within a single region, latencies tend to vary significantly. Consider, for example, API-1 where the mean value of 1411.61ms comes with a standard deviation of 6943.63.
Figure 4 presents selected examples of the average daily latencies for API-9 and API-8 over time. We see, as expected from Figure 3, how latency varies over time. In addition, we can make out that API-9 seems to be served from a single machine: the latency curves of all regions are pretty much aligned. Also, we can infer that the server for API-9 seems to be located in Oregon, which consistently features the lowest latency. In contrast, API-8 seems to be served from multiple machines - there is no clear correlation between the latency curves. Furthermore, regions Sao Paulo and Sydney seem to matter little to the API provider, as they feature considerably worse latency than the other regions.
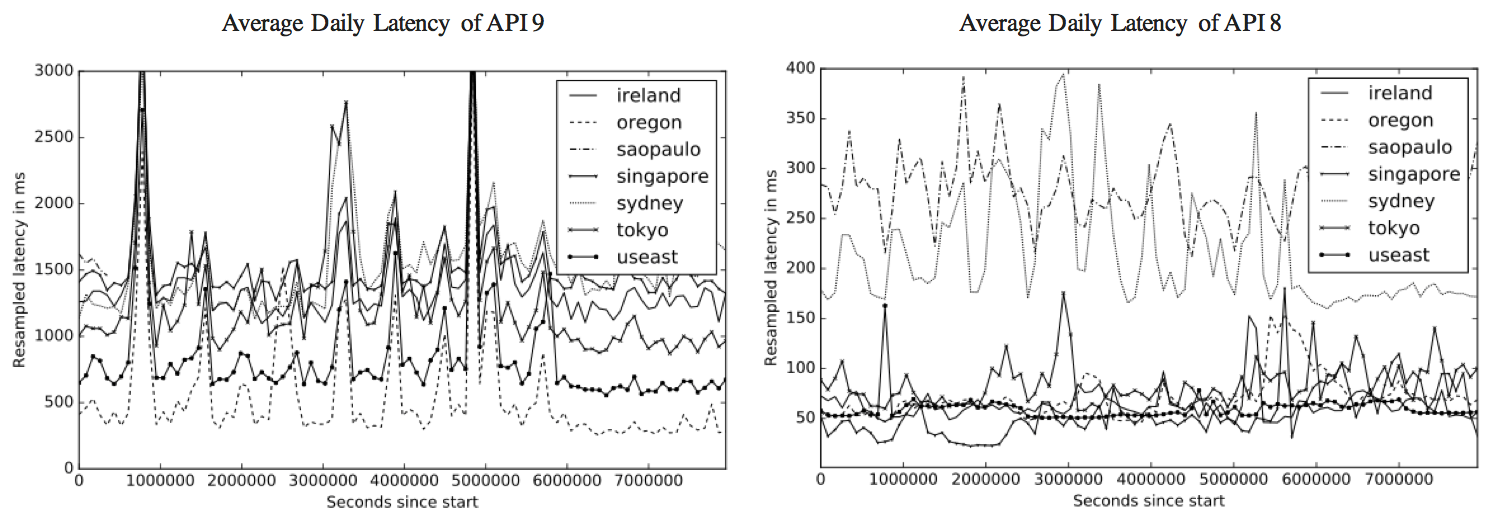 Figure 4: Average Daily Latency of API 9 and 8
Takeaways
If applications make use of web APIs, they should carefully consider the quality they can expect. As our experiments show, quality can be problematic: we observe temporal as well as long-lasting unavailabilities, some of which are geographically isolated. Furthermore, latency varies significantly across regions but also within single regions. Within our paper, we present some mitigation approaches to deal with these issues.
Maybe you have concrete examples of web API quality impacting your application - or you have ways to mitigate bad quality? If so, we would be happy to learn about them! Please leave comments or contact us directly.